Module 2 : Part 3C - GROUP BY / PIVOT
If a SUMMARY data action is obtained across the levels of another variable/field, then the summary process includes a GROUP BY action as well. The GROUP BY action simply implies that a summary will be done across the levels of one or more fields.
Example 2.3C.1 For this example, we will again consider the Small Area Health Insurance Estimates (SAHIE) data that was used in Module 2.3A. A subset of records from the original data table is considered in this module.
- Only state level data is included – all county level information has been removed
- All ages, sexes, and income categories are included (i.e. agecat=0, sexcat=0, and iprcat=0)
- A new field, Census_Region, has been added to the data table.
Source: https://www.census.gov/data/datasets/time-series/demo/sahie/estimates-acs.html
Google Folder: Link to Data
List of Fields
- State_Name: state name
- State_Abbreviation: abbreviation for state
- Census Region: Identifies the Census Region for the State (Levels: Northeast, South, Midwest, or West)
- MedicareExpansion: Had state adopted medicare expansion on year data was collected
- agecat: category of age (all ages included)
- racecat: category of race
- sexcat: category of sex (all sexes included)
- iprcat: category of income (all incomes included)
- NumberinGroup: Number of people in this demographic group
- Uninsured: Number of people uninsured in this demographic group
- Insured: Number of people insured in this demographic group
- PercentUninsured: Percent of people uninsured in this demographic group
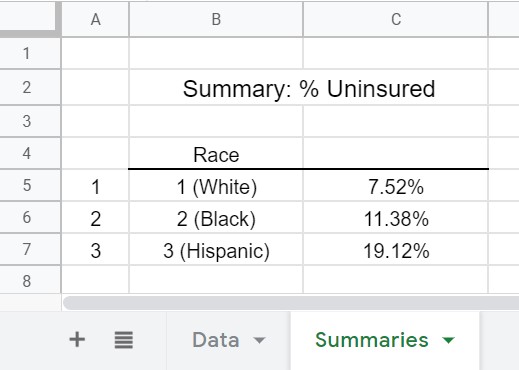
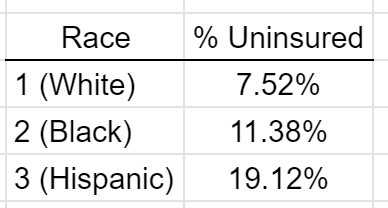
Goal: Obtain the overall percent of uninsured people by race.
| Race | % Uninsured |
| 1 (White) | 7.52% |
| 2 (Black) | 11.38% |
| 3 (Hispanic) | 19.12% |
Data Processing Steps
- Step #1: Get the SUM of total number of people for each race group
- Step #2: Get the SUM of the total number of uninsured people for each race group
- Step #3: Compute the ratio of number uninsured over number of people to get percent uninsured
Novice Level - Speadsheet
There are two basic methods of obtaining a summary measure using a spreadsheet – using a formula or using a Pivot Table. The Pivot Table approach is much easier than the formula based approach and thus will be discussed first.
Pivot Table Approach
|
GROUP BY with Pivot Tables |
|
Source: https://youtu.be/hmq-v3FURLI |
The following is the Pivot Table summary for the % Uninsured by race (1:White, 2:Black, and 3:Hispanic)
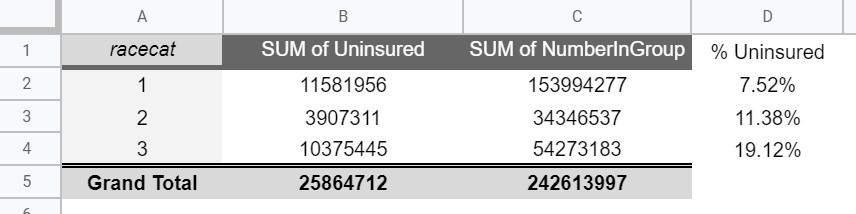
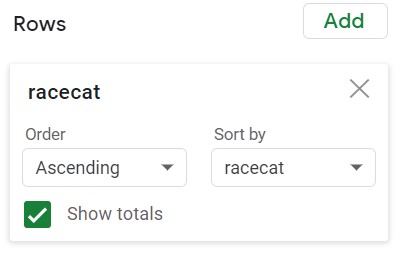
The Pivot Table above was constructed using the following setup. The Filters box is used to exclude the racecat = 0 from consideration in the summary.
| Setup of Pivot Table | |
| Rows | Columns |
|

|
| Values | Filters |
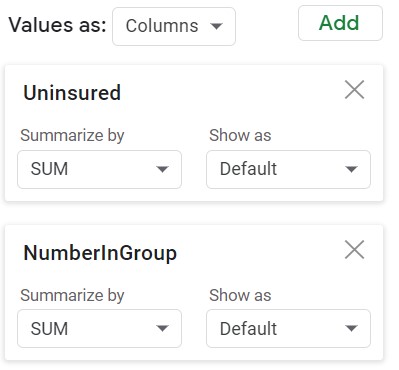
|

|
Comments:
- The SUM of Uninsured and Sum of NumberInGroup columns were provided by the Pivot Table. The % Uninsured values were computed using a simple formula.
- Technically speaking, when a field is placed placed in the Rows box, a GROUP BY action is being used; When a field is placed placed in the Columns box, a PIVOT action is being used. However, in practice, the terms GROUP BY and PIVOT tend to be used interchangeable.
FORMULA Approach
The GROUP BY action for a summary can be done using a formula-based approach as well in a spreadsheet. There is a collection of SUMIF(), AVGIF(), COUNTIF(), etc. that can be used when a single condition for the summary is needed. In addition, there is a second collection of SUMIFS(), AVGIFS(), COUNTIFS(), etc. that can be used when there are one or more conditions for the summary. The SUMIFS() function is used here to obtain the percent uninsured across race.
|
Summary via Formulas Google Sheets |
|
Source: https://youtu.be/boRMpWIO1Fk |
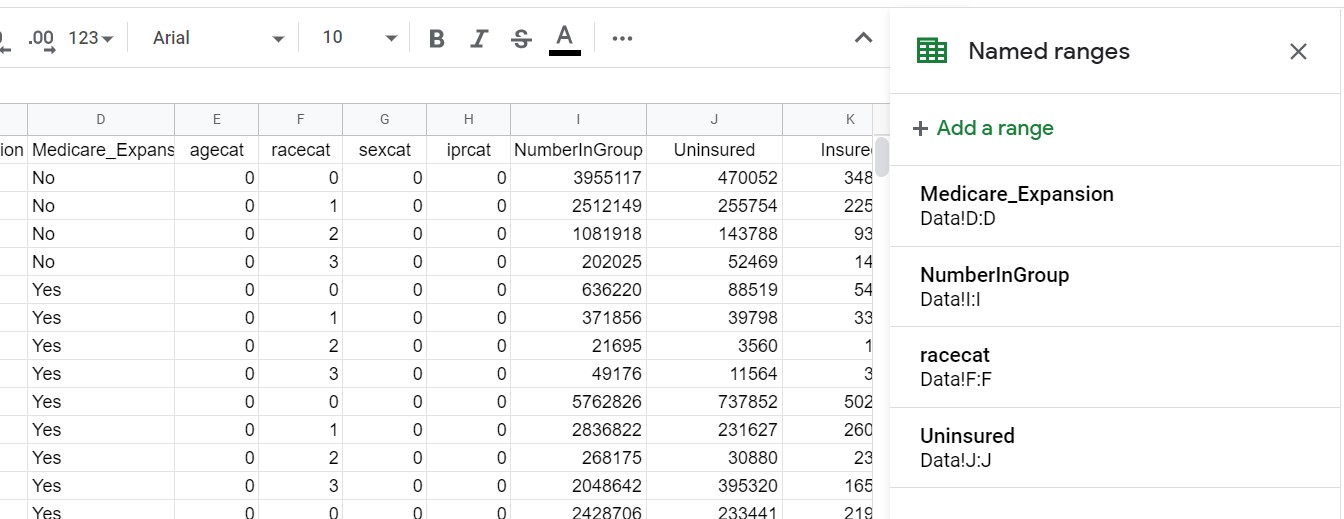
- The Uninsured, NumberInGroup, racecat, and Medicare_Expansion fields were named in the spreadsheet
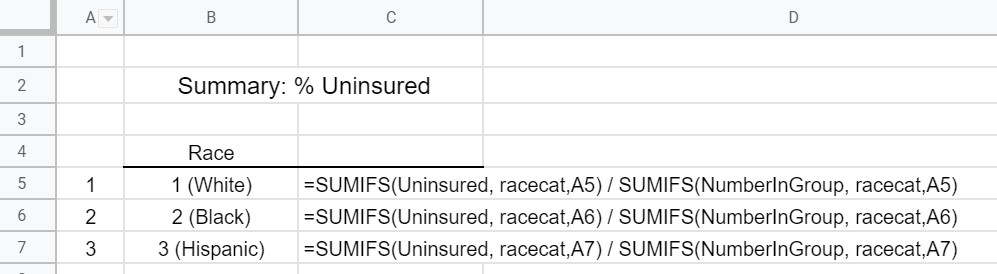
- Cells A5, A6, and A7 contain the values of racecat that are used for the condition within the =SUMIFS() function
- Two =SUMIFS() functions are used to here to obtain the sum for the numerator (Data Processing Step #1) and the sum for the denominator (Data Processing Step #2)
The use of named ranges in suggested when using formulas. The following is a list of the named ranges for this example.
The following snip-it shows the formulas used to obtain the % Uninsured for each race category.
The desired output is shown here.
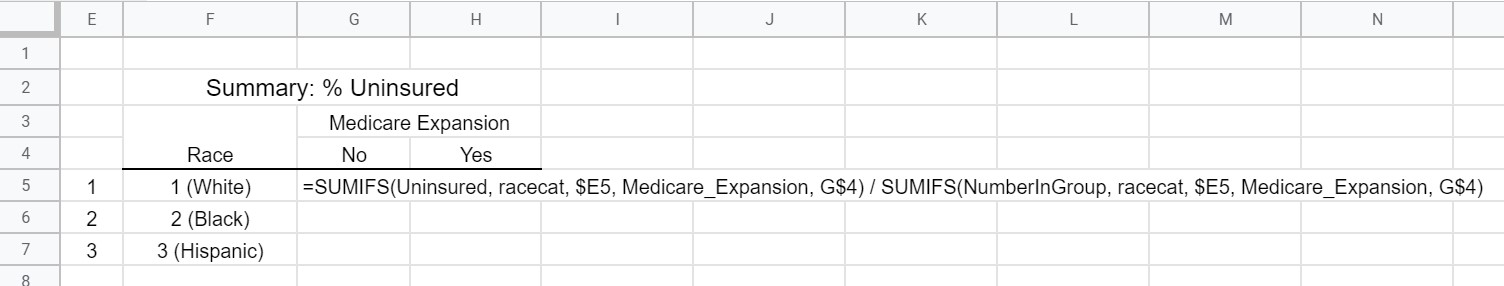
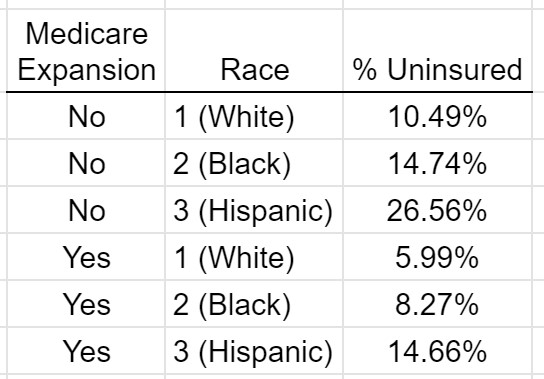
The following snip-it from the spreadsheet shows one how to add additional conditions to the =SUMIFS() function. Here, the desired summaries are to be obtained by race and across medicare expansion (i.e. has the state adopted medicare expansion?).
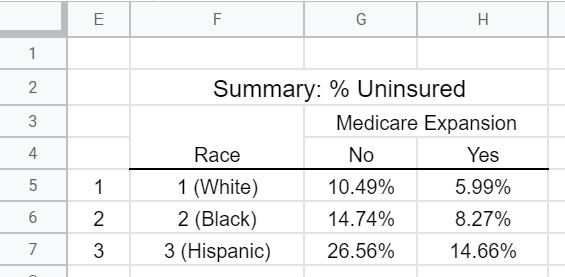
The summary table showing the % Uninsured across race and medicare expansion.
Intermediate Level - QUERY
The =QUERY() function that was used for a SUMMARY in Module 2.3B can be adapted to include both a GROUP BY and/or PIVOT. Unfortunately, there is not an analogs feature in Excel - Power Query as it is not setup to easily compute summaries on a data table; however, once the data table is loaded into an Excel sheet, a Pivot Table can be used to obtain the desired summaries.
| GROUP BY - QUERY |
|
Source: https://youtu.be/_hG_0a7Nx1k |
The =QUERY() Statement
The following query statement can be used to obtain the percent uninsured by race. The named ranged for the data table in Google Sheets is SAHIE. The desired summary table is displayed – the row/column headers on the summary table were edited to be more informative.
Note: The F != 0 is used to FILTER exclude racecat = 0 (all races) from being included in this summary table.
=QUERY( SAHIE, " SELECT F, SUM(K) / SUM(J) WHERE F != 0 GROUP BY F")
The =QUERY() function can easily be modified to obtain the percent uninsured across race and across medicare expansion. The desired summary table is displayed – again the row/column headers were edited to be more informative.
=QUERY( SAHIE, " SELECT D, F, SUM(K) / SUM(J) WHERE F != 0 GROUP BY D, F")
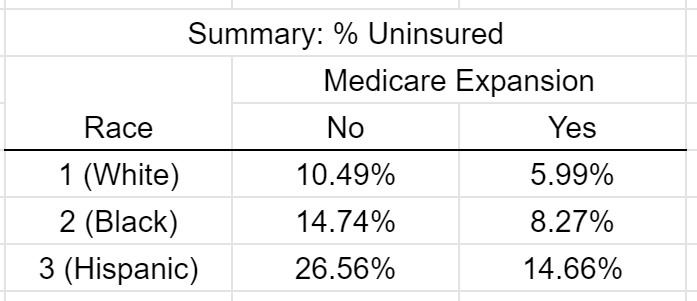
The =QUERY() function can be modified to include a PIVOT action. Here, Medicare_Expansion is being used to pivot; thus, the summaries will be displayed as columns in the output table (not as rows). The desired summary table is displayed here – the row/column headers were edited to be more informative.
=QUERY(SAHIE, “SELECT F, SUM(J) / SUM(I) WHERE F != 0 GROUP BY F PIVOT D”)
Comments:
- Similar to other approaches, a variety of summary measures exist for the =QUERY() function, e.g. AVG(), MIN(), MAX, etc.
- Other data actions, e.g. ORDER BY, LIMIT, etc., can be included in the SELECT statement to modify the structure of the summary table.
Advanced Level - Python
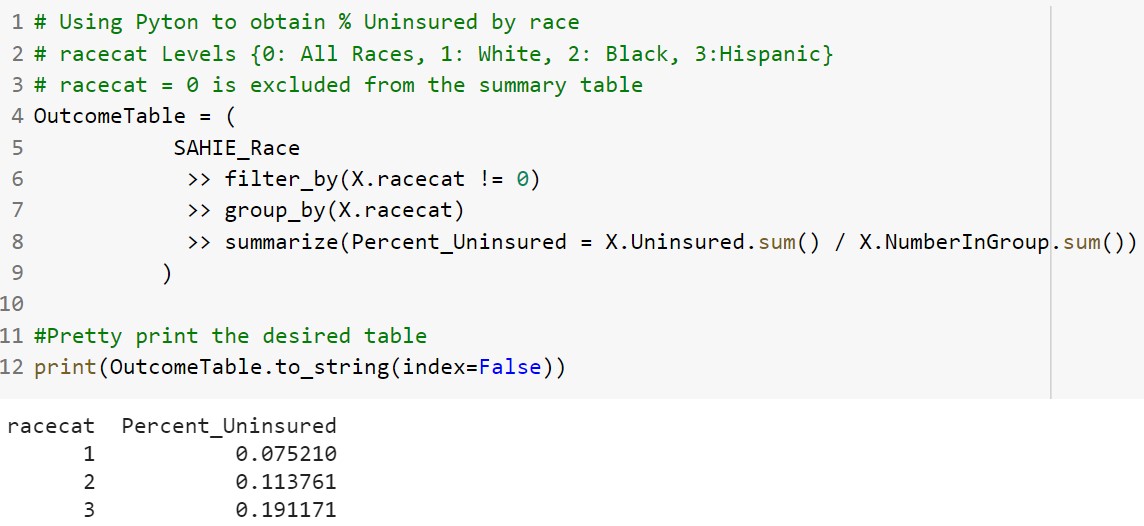
A Python script can be written to obtain the percent uninsured across race. The following video shows you how to obtain the desired summary table in Python.
Source: https://youtu.be/quECW1Aldgw
The Python code for this example was written using the pandas and dfply packages. The desired summaries can be obtained using the following Python code.
To obtain the percent uninsured across race and across medicare expansion, the group_by() function will include both fields and the spread() function can be used to pivot on medicare expansion so the percent uninsured appears in two separate columns.
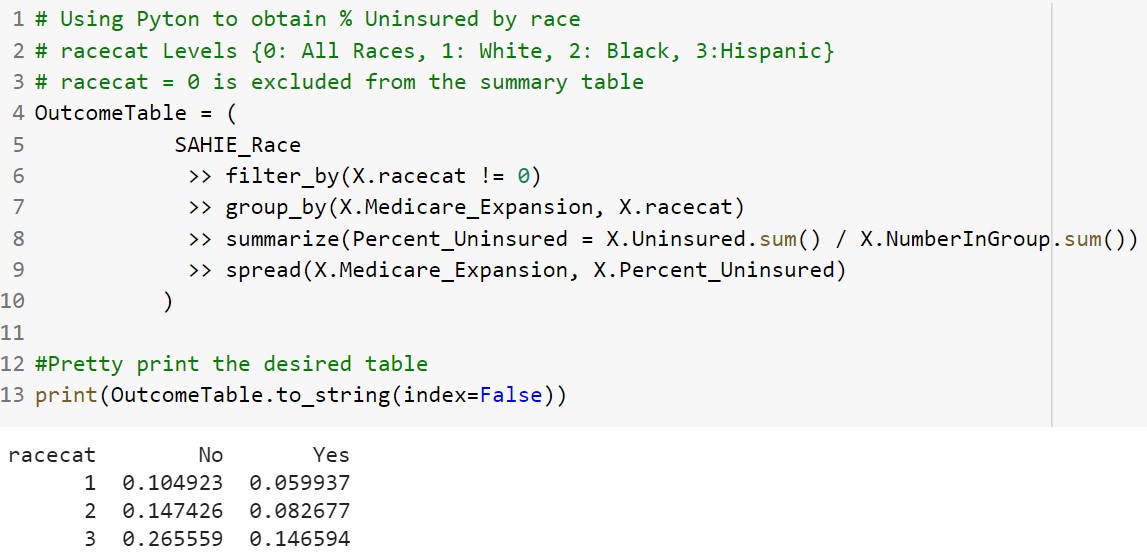
You are able to obtain your own copy of this Python code. To obtain a copy of this file, click the Python Code link, and select Open in Colab.
Python Code: https://github.com/christophermalone/HLA311/blob/main/Module2_Part3C_Advanced.ipynb
Task
Example 2.3C.2: This task will again use the Home Health Care Agencies data that was used for the task in Module 2.3B. The data includes many fields, but a limited set of fields will be considered here.
- State: The state in which the home health care agency is located
- Type of Ownership: Identifies the type of ownership – levels include various government type, various non profit types, and proprietary (for profit).
- PatientCareStarRating: The overall star rating for the home health agency
Source: https://data.cms.gov/provider-data/dataset/6jpm-sxkc
Google Folder: Link to Data
Answer the following questions for this task.
1. Obtain a summary table that includes the average patient care star rating across Ownership type. Include a screen-shot of your summary table.
The following window will be used upload a screen-shot of your work.
Remove this screenshot and submit another
| TRUE | FALSE | |
| 2. The home health care agencies that are Proprietary (i.e. For Profit) had the highest average patient care star rating. |
3. My summary table had a blank row. The reason for the blank row is the some home health agencies do not have a patient star rating (i.e. there are some missing values for the patient star rating in this data). Use a FILTER action to remove the blank row from your summary table. Include a screen-shot of the updated summary table.
The following window will be used upload a screen-shot of your work.
Remove this screenshot and submit another
4. Briefly describe how you applied the FILTER in question 2. That is, describe how you removed the blank row from the summary table.
5. Obtain a summary table that includes the average patient care star rating for each State. Include a screen-shot of the first few rows of your summary table.
The following window will be used upload a screen-shot of your work.
Remove this screenshot and submit another
6. How does Minnesota compare to other states regarding the average patient care star rating?
7. Obtain a Top 10 List of the States who have the highest average patient star rating for the home health care agencies in their state. Include a screen shot of your Top 10 list.
The following window will be used upload a screen-shot of your work.
Remove this screenshot and submit another